NewGen Training Series

Introduction to Energy Markets

How wholesale electricity is bought, sold, and priced — from deregulation to real-time market clearing. The framework every utility professional needs to understand.

7U.S. RTOs/ISOs
190M+People Served
$400B+Annual Market
Scroll to start

The Road to Deregulation

For most of the 20th century, electric utilities were vertically integrated regulated monopolies — owning generation, transmission, and distribution. A series of federal policy changes opened the door to competitive wholesale markets.

Learning Objectives

  • Trace the key federal policies (PURPA, EPAct 1992, FERC Orders 888/889/2000) that opened electricity to competition
  • Explain why the transition from regulated monopolies to competitive markets occurred
  • Identify which parts of the electricity value chain were deregulated and which remain regulated

The Traditional Model

Under the vertically integrated model, a single utility owned everything from the power plant to the meter. Rates were set by regulators to cover costs plus a reasonable return. Wholesale power trading, where it existed, was bilateral — negotiated directly between utilities.

This model worked well when economies of scale kept driving costs down. But by the 1970s, nuclear cost overruns, environmental regulation, and technology shifts began pushing costs up — creating pressure for a new approach.

Why Deregulate?

Rising Costs

Nuclear and coal plant costs escalated. By the 1980s, many utilities had overcapacity and ratepayers were unhappy.

Competition Theory

Policymakers believed competitive markets — like those transforming telecommunications — could lower electricity costs through market efficiency.

Key Federal Actions

1

PURPA (1978)

Opened the door to non-utility generators

2

EPAct (1992)

Required integrated resource planning, renewable support

3

FERC 888 (1996)

Open access transmission, led to ISOs

4

FERC 2000 (1999–2000)

Promoted RTOs, competitive wholesale markets

5

EPAct (2005)

Renewable tax credits, efficiency standards

Regulatory Bodies

FERC

Federal Energy Regulatory Commission — regulates interstate wholesale electricity sales and transmission. Approves RTO/ISO tariffs, market rules, and reliability standards. Sets the rules for competitive markets.

NERC

North American Electric Reliability Corporation — develops and enforces mandatory reliability standards for the bulk power system. Designated by FERC as the Electric Reliability Organization (ERO) in 2006.

State PUCs

Public Utility Commissions regulate retail utilities and distribution. Each state determines its own approach to retail competition, rate design, and resource planning. The result is a patchwork of regulatory frameworks.

Key Takeaways

  • Federal policy gradually opened wholesale electricity to competition over three decades (1978-2000)
  • Generation and wholesale trading were deregulated; transmission and distribution remain regulated
  • The result is a patchwork: some regions have organized markets, others retain traditional bilateral arrangements

Next: How is the physical grid organized to support these market structures?

How the Grid Is Organized

The North American bulk power system is divided into three major interconnections, each operating as a synchronized AC network. Within these interconnections, regional organizations manage reliability and markets.

Learning Objectives

  • Describe the three major North American interconnections and their significance
  • Explain why the grid is organized into interconnections and balancing authorities
  • Identify the role of AC synchronization and DC ties in grid architecture

Eastern Interconnection

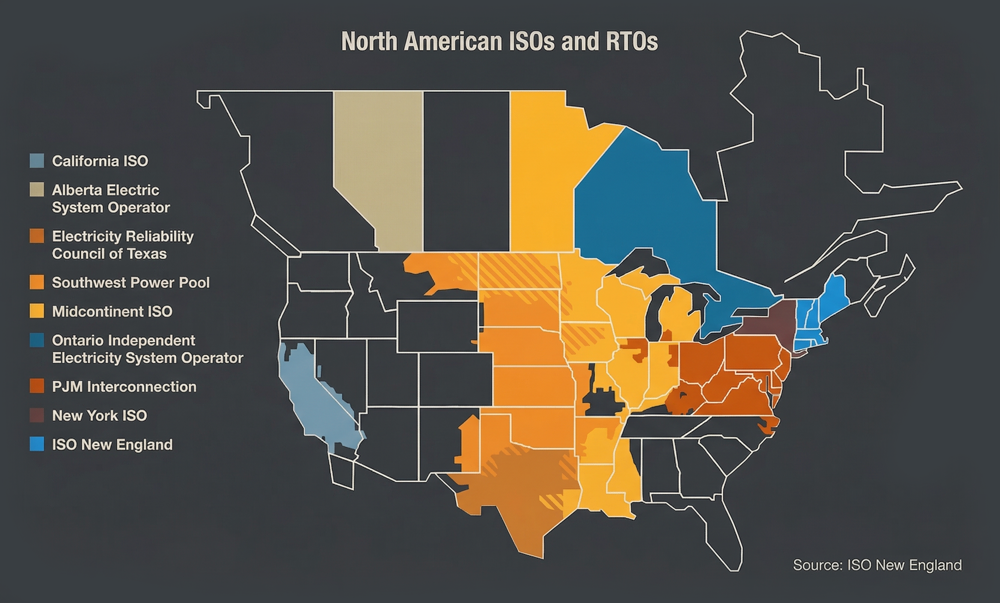
The largest, covering everything east of the Rockies (except Texas). Includes PJM, MISO, SPP, NYISO, ISO-NE, and the Southeast. All generators synchronized at 60 Hz.

Western Interconnection

Covers the western U.S. and parts of Canada/Mexico. Managed by WECC. Includes CAISO and a patchwork of balancing authorities. Connected to the Eastern via limited DC ties.

Texas (ERCOT)

Operates its own interconnection, largely avoiding federal jurisdiction. Managed by ERCOT. Connected to the Eastern by limited DC ties. Serves about 26 million customers.

NERC Reliability Regions

NERC oversees six Regional Entities (EROs) that monitor compliance with reliability standards across North America.

U.S. Electricity Market Coverage

Approximately two-thirds of U.S. electricity consumers are served within organized RTO/ISO wholesale markets.

North American ISOs and RTOs map
NERC RegionCoverage AreaKey RTOs/ISOs
NPCCNortheast U.S. & CanadaNYISO, ISO-NE
RFMid-Atlantic, Great LakesPJM
SERCSoutheast U.S.No organized market (bilateral)
MROMidwest, Great PlainsMISO, SPP
TRETexasERCOT
WECCWestern U.S., Canada, MexicoCAISO

Key Takeaways

  • North America operates as three synchronized AC interconnections (Eastern, Western, ERCOT) linked by DC ties
  • Within each interconnection, balancing authorities and RTOs coordinate generation and load in real time
  • This physical architecture shapes which markets a utility can access and how power flows

Next: Who runs these markets? RTOs and ISOs — the institutions at the center of wholesale electricity.

RTOs & ISOs

Regional Transmission Organizations (RTOs) and Independent System Operators (ISOs) are the institutions that run wholesale electricity markets. They independently operate the transmission grid, dispatch generation, and administer competitive markets.

Learning Objectives

  • Explain the core functions of RTOs and ISOs: grid operation, market administration, and reliability coordination
  • Compare the major RTOs by geographic coverage, market design, and generation mix
  • Evaluate the advantages and disadvantages of organized markets vs. bilateral trading

What They Do

RTOs/ISOs serve as neutral market operators, managing the physical grid and the financial markets that determine who generates electricity and at what price.

  • Coordinate generation dispatch in real time to meet demand at lowest cost
  • Operate the transmission system for fair, non-discriminatory access
  • Run day-ahead and real-time energy markets
  • Manage transmission congestion and pricing
  • Assess generation planning reserves and resource adequacy
  • Operate the financial settlement system for all market participants

RTO vs. ISO

The terms are often used interchangeably, but there are technical differences:

RTO (Regional Transmission Organization)

Typically covers a larger, multi-state area. Encouraged by FERC Order 2000 (1999). Examples: PJM, SPP, MISO.

ISO (Independent System Operator)

Often covers a single state or smaller region. Emerged as a compliance pathway under FERC Order 888 (1996). Examples: CAISO, ERCOT, NYISO, ISO-NE. Note: FERC considers the distinction between ISOs and RTOs largely semantic today — both perform the same core functions.

Not Everywhere

The Southeast and parts of the Northwest still operate under the traditional bilateral model with no organized market. Utilities trade power through direct negotiations.

Major U.S. RTOs/ISOs by Load Served

PJM is the largest wholesale market in the world, serving over 65 million people across 13 states and D.C.

Western Market Expansion (2025–2027): The Western Interconnection is undergoing its most significant market transformation in decades. CAISO’s Extended Day-Ahead Market (EDAM) is set to launch in 2026, extending organized day-ahead trading across much of the West. Simultaneously, SPP’s Markets+ is planned for 2027, offering an alternative market framework. These developments are converting the Western patchwork of bilateral arrangements into organized markets — potentially serving over 80% of Western load by 2028.

Southeast Energy Exchange Market (SEEM): Launched in November 2022, SEEM provides automated intra-hour energy trading among Southeast utilities — a modest but meaningful step toward market transparency in a region that has historically resisted RTO formation. While SEEM lacks the full price formation and capacity market features of an RTO, it demonstrates growing momentum toward organized trading even in traditionally bilateral regions.

Pros of Organized Markets

Generally lower energy costs through efficient dispatch of the cheapest generation across a wider footprint

Enhanced reliability with more generation resources available in emergencies

Eliminates “pancaked” transmission charges for power crossing utility boundaries

Market transparency and non-discriminatory access for all participants

Cons & Challenges

Utilities with inefficient generation may see those units dispatched less or not at all

Loss of direct operational control over generation assets

Can be slow to adapt to new technologies: batteries, demand response, behind-the-meter generation

Price volatility during extreme events (e.g., Winter Storm Uri in ERCOT, 2021)

Key Takeaways

  • RTOs/ISOs operate the grid, run wholesale markets, and coordinate reliability across large regions
  • Each RTO has a distinct generation mix, market design, and regulatory history
  • Organized markets offer price transparency and efficient dispatch but can expose participants to volatility

Next: What specific types of markets do these RTOs operate, and what purpose does each serve?

FERC Order 1920 (2024): The most significant transmission planning reform in decades, Order 1920 requires utilities to conduct long-term (20-year), scenario-based transmission planning that accounts for future generation mix changes, load growth, and extreme weather. It also reforms cost allocation methods for regional transmission projects. For utilities in organized markets, this will reshape how transmission costs are planned, built, and recovered through rates.

Types of Electricity Markets

Organized wholesale markets operate several distinct but interrelated markets, each serving a specific purpose in keeping the lights on reliably and affordably.

Learning Objectives

  • Distinguish between day-ahead, real-time, capacity, and ancillary services markets
  • Explain how each market type serves a different function in maintaining reliability and economic efficiency
  • Describe how capacity markets ensure long-term resource adequacy beyond daily energy needs

Day-Ahead Energy Market

The majority of wholesale energy transactions occur here. Generators submit supply offers, utilities submit demand bids, and the market clears hourly prices for the next day. Based on forecasted weather, planned outages, and expected demand.

All organized markets operate this

Real-Time Energy Market

Adjusts for actual conditions on 5–15 minute intervals. Handles differences from the day-ahead schedule caused by unplanned outages, unexpected congestion, or demand changes. Uses Locational Marginal Pricing (LMP). Typically more volatile.

All organized markets operate this

Capacity Market

Procures commitments of generation capacity for future delivery — ensuring sufficient resources exist to meet peak demand. Payments are made in addition to energy revenues. Timeframes vary by market (1–3+ years ahead).

ISO-NE, NYISO, PJM, MISO have centralized markets

Ancillary Services Market

Procures the reliability services needed to keep the grid stable: frequency regulation (up and down), spinning reserves (ramp in 10 min), non-spinning reserves (start in 10–30 min), voltage support, black start capability, and energy imbalance services.

All markets — exact services vary

What Markets Provide

Electricity markets serve four critical functions: cost recovery for power resources (incentivizing continued generation), resource allocation through price signals (build more or retire), reliability through coordinated dispatch and reserves, and competition that encourages the lowest-cost power to be dispatched first.

The Resource Adequacy Challenge: By 2025–2026, multiple RTOs are raising alarms about future capacity shortfalls. MISO’s capacity auction cleared at record prices in 2022–2023, signaling tightening reserves. PJM has overhauled its capacity market rules amid concerns about reliability during the clean energy transition. ERCOT, which lacks a traditional capacity market, continues to refine its market design after Winter Storm Uri exposed resource adequacy gaps. The core tension: ensuring enough firm, dispatchable capacity remains available as the generation mix shifts toward variable renewables — while keeping capacity costs reasonable for ratepayers.

Typical Day-Ahead vs. Real-Time Price Patterns

Day-ahead prices are smoother; real-time prices reflect actual conditions with higher volatility. Example summer day ($/MWh).

Key Takeaways

  • Four market types work together: day-ahead (planning), real-time (balancing), capacity (long-term adequacy), and ancillary services (reliability)
  • Each market serves a distinct function — confusing them leads to misunderstanding price signals and cost drivers
  • Capacity markets ensure generation investment even when energy prices alone may not support it

Next: How are prices actually set in these markets? The answer starts with the clearing price auction.

How Electricity Is Priced

Wholesale electricity markets use a single clearing price auction. Understanding how this works is essential to understanding why prices move and what drives generator revenue.

Learning Objectives

  • Explain the single clearing price auction mechanism and how the marginal unit sets the price for all generators
  • Define locational marginal pricing (LMP) and its three components: energy, congestion, and losses
  • Interpret a supply stack chart and predict how changes in fuel costs or demand affect wholesale prices

The Supply Stack

Generators submit offers to the market, stating how much power they can supply and at what price. The market operator stacks these offers from lowest to highest cost and dispatches them in order until demand is met.

The price offered by the last (most expensive) generator needed to meet demand becomes the clearing price that all dispatched generators receive.

This means low-cost generators (nuclear, renewables, efficient gas) earn more than their offer price — the difference is called the inframarginal rent and is how generators recover their fixed costs and earn a return.

Locational Marginal Pricing (LMP)

Real-time prices vary by location on the grid. LMP at any node reflects three components:

Energy Component

The marginal cost of the next MW of generation dispatched system-wide.

Congestion Component

Added cost when transmission constraints force more expensive local generation to run.

Loss Component

Marginal cost of transmission losses from generator to load point.

Interactive: Single Clearing Price Auction

See how the clearing price changes as demand increases. Three plants bid into the market. Click a demand level to see the result.

Plant A provides all 500 MW. Plants B and C are not needed.

Clearing Price: $50/MWh

Total hourly cost: $25,000

The Supply Stack: Merit Order Dispatch

Generation resources are dispatched from cheapest to most expensive. Renewables and nuclear run first (low marginal cost), followed by gas, then peakers.

When Prices Go Negative: In markets with high renewable penetration, wholesale prices increasingly go negative — meaning generators pay to stay dispatched. This occurs when renewable output exceeds demand and inflexible generators (nuclear, some gas) cannot ramp down quickly enough. Negative prices are now routine in CAISO, SPP, and ERCOT during sunny, windy, low-demand periods. With Inflation Reduction Act production tax credits, wind generators can profit even at negative market prices (the PTC value exceeds operating costs), which intensifies the phenomenon. Negative prices signal the grid’s growing need for flexible demand, storage, and transmission to absorb renewable output.

The IRA and the Supply Stack: The Inflation Reduction Act (2022) fundamentally altered wholesale market economics. Production tax credits effectively make wind and solar’s marginal cost negative — they will pay to generate because the credit value exceeds their operating cost. Investment tax credits have made battery storage economically viable at scale, adding a new category of flexible resources to the supply stack. For utilities evaluating power supply options, IRA incentives have made clean energy the lowest-cost new generation in most markets, reshaping long-term resource planning and wholesale price expectations.

Key Takeaways

  • All generators in a clearing-price auction receive the price set by the most expensive unit needed to meet demand
  • LMP adds geographic precision: congestion and losses make prices vary by location on the grid
  • The supply stack (merit order) determines which generators run — renewables and nuclear first, then gas, then peakers

Next: What does all this mean for utilities managing power supply costs and designing retail rates?

What This Means for Utilities

Whether your utility operates within an organized market or under bilateral contracts, wholesale energy market dynamics directly affect your power supply costs, resource planning, and ultimately your retail rates.

Learning Objectives

  • Connect wholesale market dynamics to retail rate impacts for both market-participant and bilateral-contract utilities
  • Identify how renewable energy growth, storage, and DER are changing market price formation
  • Explain why understanding energy markets matters for power supply cost management and rate design

Power Supply Cost Exposure

Market prices are driven by fuel costs (especially natural gas), demand levels, transmission congestion, and renewable generation availability. Understanding these drivers helps utilities forecast and manage their largest expense category.

Resource Planning Decisions

Market price signals inform build-vs-buy decisions. If market prices are low enough, purchasing power may be cheaper than building new generation. Capacity market revenues can make new builds viable that energy margins alone wouldn’t support.

Rate Design & Pass-Through

How a utility structures its power cost recovery mechanisms — fuel adjustment clauses, purchased power adjustments, capacity charges — determines how market volatility is shared between the utility and its customers.

Renewable & Storage Integration

Zero-marginal-cost renewables are reshaping supply stacks and depressing energy market prices. Battery storage is creating new opportunities in ancillary services and capacity markets. Markets are evolving to accommodate these resources.

Wholesale Price Trends

Average annual wholesale hub prices ($/MWh) showing the impact of natural gas prices, renewable buildout, and extreme weather events.

Case Study — Winter Storm Uri (February 2021): Uri exposed vulnerabilities across the electricity value chain. In ERCOT, wholesale prices hit the $9,000/MWh cap for days as generation failed in extreme cold. Approximately 4.5 million Texas households lost power, some for days, with roughly 10 million people affected across the broader region. The event triggered sweeping market reforms: mandatory weatherization standards, a new Performance Credit Mechanism for capacity, increased reserve margins, and renewed debate about whether ERCOT should establish a capacity market or join an interconnection. For utilities nationwide, Uri demonstrated that market design assumptions built around historical weather patterns are inadequate — and that extreme weather risk must be priced into both resource planning and rate design.

The Evolving Landscape

Energy markets are not static. The rapid growth of renewables, battery storage, distributed generation, and demand response is fundamentally changing price formation, reliability planning, and market design. Utilities that understand these dynamics are better positioned to manage costs, plan resources, and design rates that serve their customers well.

Key Takeaways

  • Wholesale market dynamics directly affect retail rates — whether a utility buys in organized markets or through bilateral contracts
  • Renewable growth is reshaping price formation, creating new opportunities and risks for power supply management
  • Utilities that understand market mechanics are better positioned to manage costs, plan resources, and design effective rates

How NewGen Can Help

Navigating energy markets requires deep technical expertise and jurisdictional knowledge. We bring both to every engagement.

Thousands of Rate Studies

We’ve guided utilities through cost-of-service and rate design across every market structure — organized RTOs, bilateral regions, and everything in between. Our expertise spans jurisdictional nuances, regulatory frameworks, and stakeholder dynamics that shape successful rate outcomes.

Market-Informed Analysis

We help utilities understand how wholesale market dynamics — LMP, capacity prices, ancillary service revenue — impact their revenue requirements and rate structures. Real-time market data and forecasting models inform strategic planning and financial performance.

Stakeholder Communication

We translate complex market mechanisms into clear narratives for boards, commissions, staff, and the communities you serve. Effective stakeholder engagement builds trust, aligns incentives, and supports informed decision-making throughout your organization.

Power Supply Strategy

We help utilities optimize their power supply portfolio by evaluating self-generation versus market purchases, managing wholesale market exposure, and developing long-term procurement strategies. Strategic supply decisions directly impact cost recovery, risk management, and financial stability.

Trusted Advisors

The utility landscape is changing fast — distributed energy, electrification, aging infrastructure, shifting demographics. We don’t just solve today’s rate case. We help you build a framework for the challenges ahead.

Experts in Your Data

Your billing data, financial records, and system metrics hold the answers — but only if you know how to read them. We help utilities unlock insights from their own data to build smarter rate structures and more accurate cost allocations.

Ready to start the conversation?

Connect With NewGen →