NewGen Innovation · GridLens™
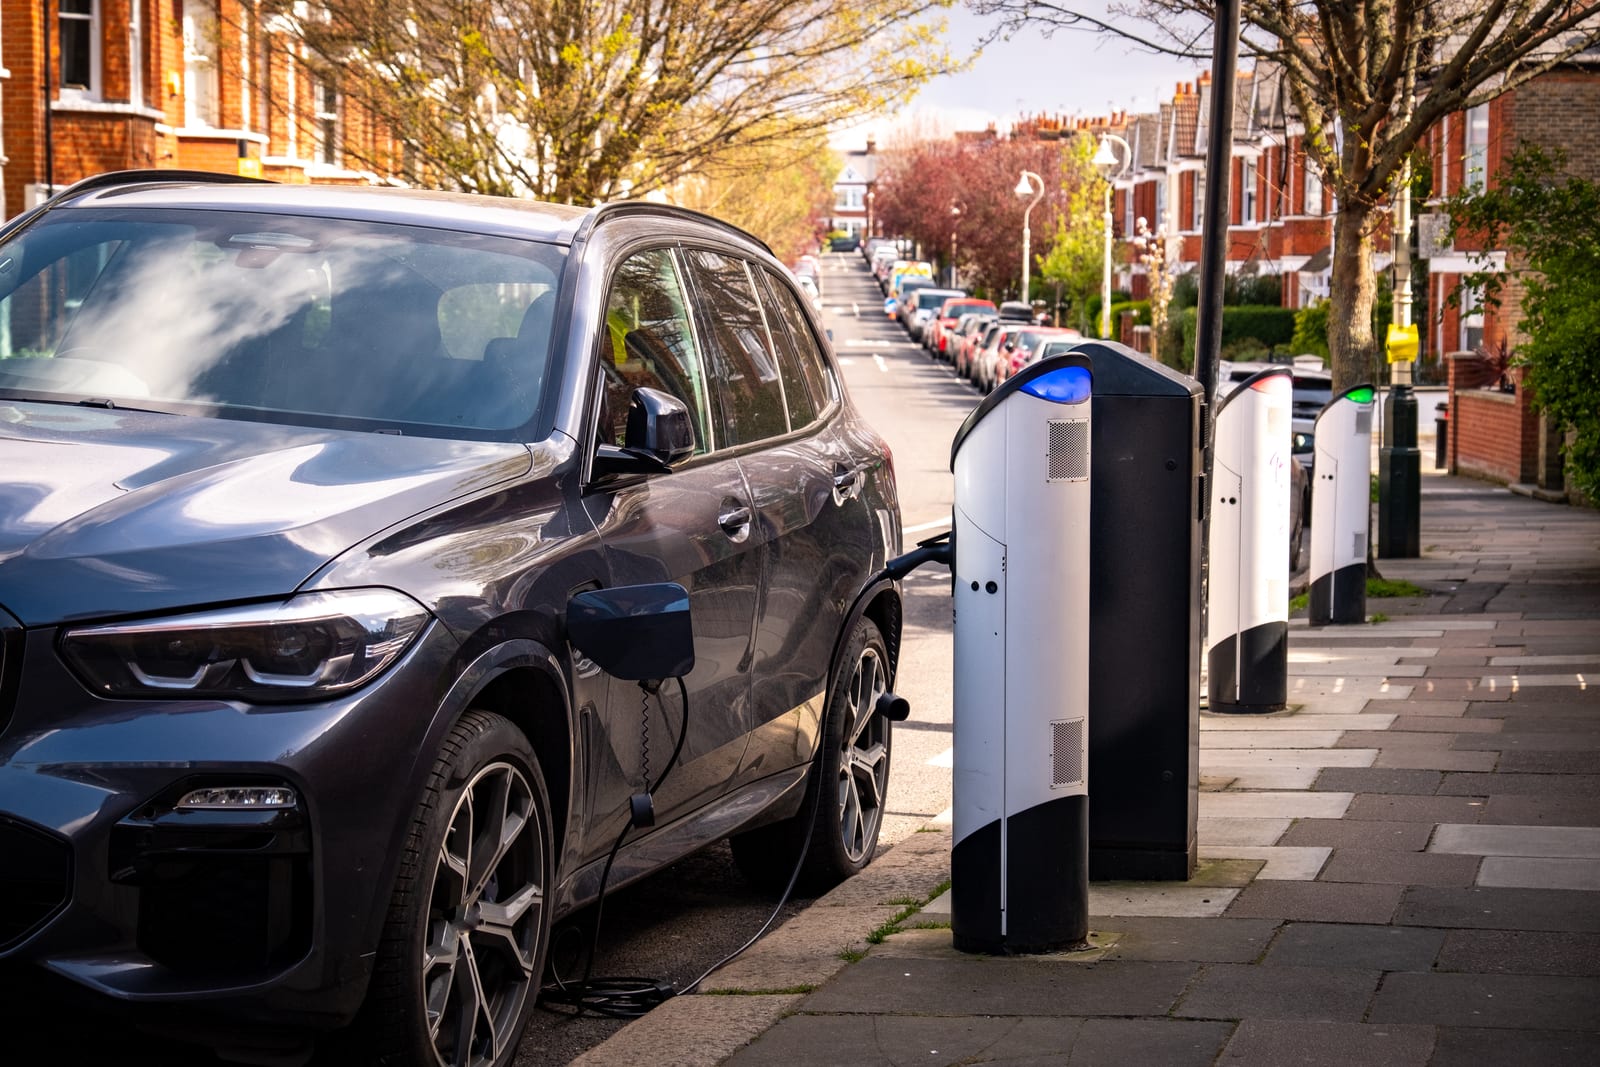
EVs are already on your grid.
Can you see them?
GridLens™ uses the Advanced Metering Infrastructure (AMI) data you already own to map where electric vehicles are charging across your entire service territory—no customer sign-ups, no telematics, no new meters.
The visibility gap, by the numbers
Whether it is a problem or an asset comes down to your ability to see it.
A Level 2 home charger can draw over 6 kilowatts and usually switches on in the early evening, when the system is most stressed. However, since cars sit parked most of the day, that load is also far more flexible than the loads for air conditioning or water heating.
Seen and managed, EV load provides flexible capacity that shaves peaks and defers costly distribution upgrades. Left unseen, it quietly becomes a planning issue, and the drivers causing local transformer strain are often the least likely to participate in programs.
Voluntary enrollment is not a path to grid visibility. The EVs that pose the greatest risk are often those that remain undetected.
Vehicle registrations are coarse and out of date. Rebate records capture only the customers who already raised their hands. The answer is in data you already own.
We turn meter data into images, then use computer vision to read it.
AMI data is, at its core, a long time series. The conventional approach feeds that series into a recurrent network or a hand-engineered feature pipeline. GridLens™ does something different.
It reshapes each meter's consumption history into a 2D array—days on one axis, hours on the other—and treats it as an image. Suddenly, a decade of advances in convolutional neural networks, the same architectures driving medical imaging and satellite analytics, have become available for load disaggregation.
The model learns the visual fingerprint of EV charging: the sharp, repeated late-evening stripes that appear when a vehicle plugs in after the commute home, distinct from the gentler curve of HVAC or the spiky pattern of resistive water heating.
Built for utility teams, not data science teams.
CNN-based load disaggregation has been studied in academic literature for years. Putting it in the hands of planning, rates, and customer-programs staff has not. GridLens™ is a GUI-driven platform that lets your team train, evaluate, and deploy models against your own AMI data—without writing a line of code.
- Point-and-run workflow. Upload AMI data, set a date range and threshold, run predictions, and read clear charts, not raw model output.
- Supervised EV detection. Flags likely EV charging with enough confidence to stand behind real planning and program decisions.
- Unsupervised clustering. No labeled data yet? GridLens™ surfaces outlier load shapes that warrant a closer look.
- Robust by design. PCA, normalization, and other preprocessing steps adjust automatically for differences across climate zones and rate classes.
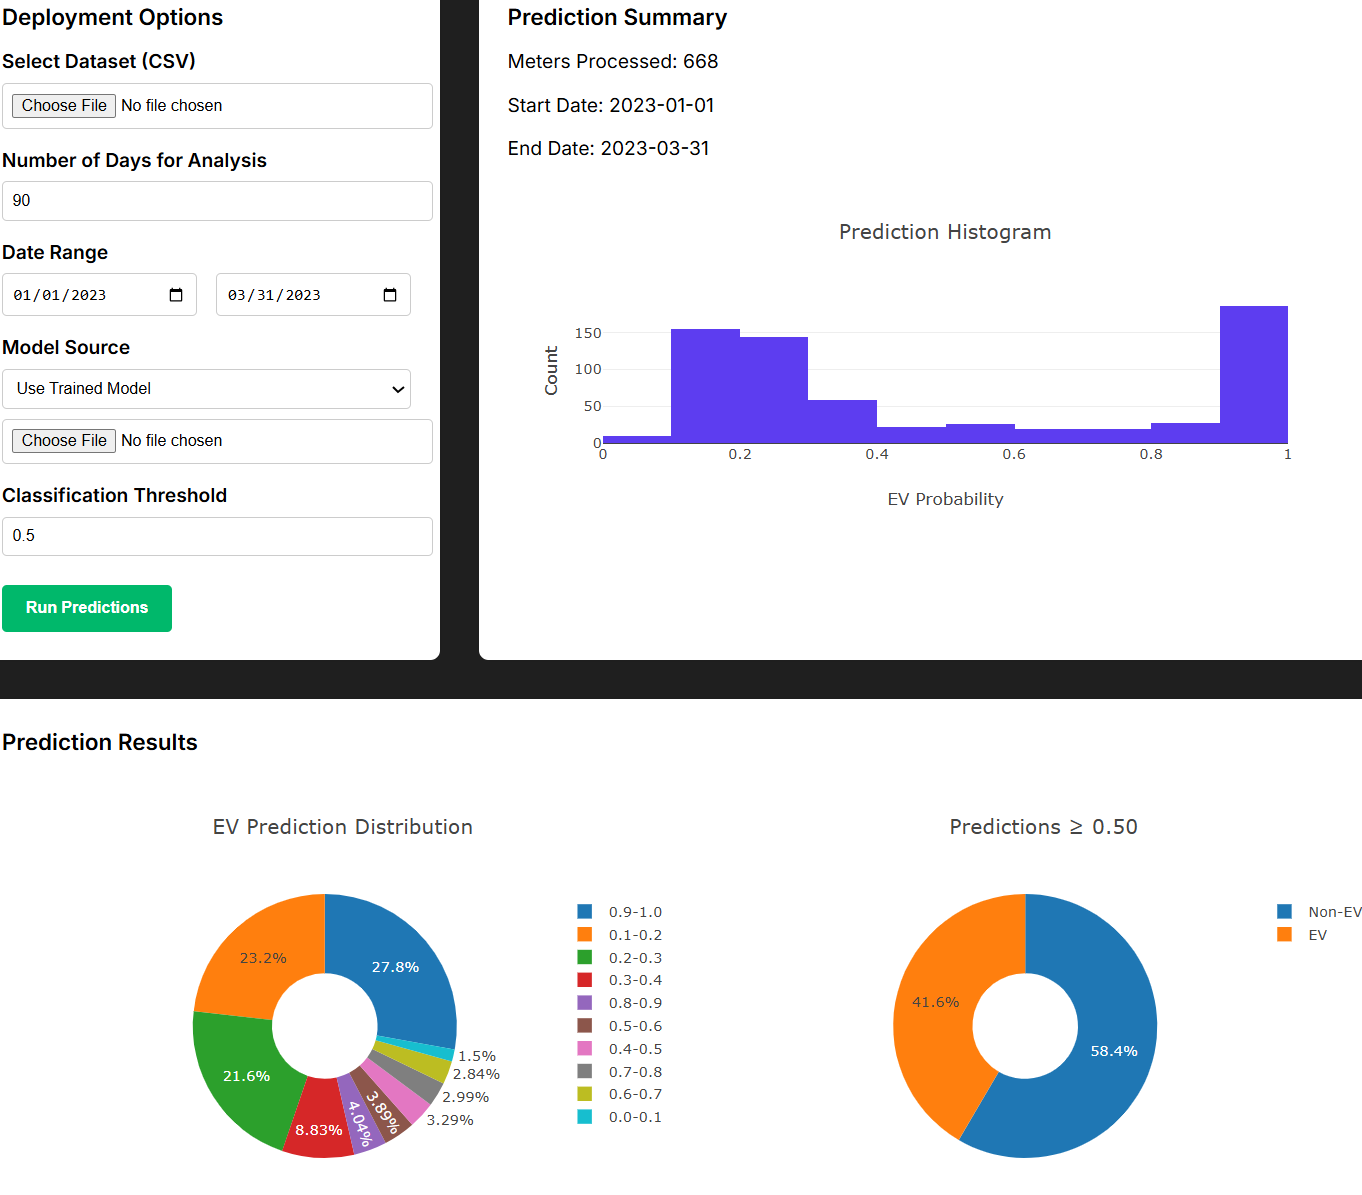
The GridLens™ prediction workspace — upload data, set a threshold, read the results.
Visibility is the starting point, not the finish line.
Once you can see your EV load, you can act with evidence instead of assumption—across the decisions that matter most.
Distribution Planning
Target the right circuits and transformers, and defer upgrades where flexible EV load can carry the peak.
Rate & TOU Design
Design rates customers will actually respond to, and size enrollment against the load that's really there.
Program Targeting
Reach the EV households that managed-charging and incentive programs miss when they wait for sign-ups.
Forecasting
Ground 10-year load assumptions in observed adoption and charging behavior, not registration proxies.
Accurate enough to stand behind real decisions.
GridLens™ produces a defensible, probabilistic map of where EVs charge, built entirely from data the utility already owns.
On real utility datasets—strong enough for planning, targeting, and TOU design.
In a NewGen engagement for Peninsula Clean Energy on AMI load profiles.
Charging accounts identified that were not captured in DMV records.
The harder problem is interpretation.
Anyone with a Python environment and a few weekends can build a classifier. The tougher questions come after the model runs, like deciding which feeders to re-rate first, what the results mean for TOU program design, and how the clusters might affect a 10-year forecast.
That's the real work, and it's where NewGen's expertise in utility planning, rates, and forecasting makes a difference. The model is a means to it.
From the team behind GridLens™
Hear from our experts.
The team who built GridLens™ explains their approach, what the tool finds in your AMI data, and why it matters for your grid.
Our team on what GridLens™ sees in your AMI data — and why it matters.
Questions utility teams ask
What data does GridLens™ need?
GridLens™ uses the AMI interval data you already have, typically 15-minute or hourly meter reads. You do not need customer self-reporting, telematics, or charger-level metering. GridLens™ normalizes your data and adjusts automatically for differences across climate zones and rate classes.
Do I need a data science team to use it?
No. GridLens™ is GUI-driven and designed for planning, rates, and customer-programs staff. Your team can train, evaluate, and deploy models using your own AMI data without writing code. It also supports unsupervised clustering for utilities that do not have labeled data yet.
How accurate is it?
On real utility datasets, GridLens™ currently achieves ROC AUC scores between 0.85 and 0.95. This is strong enough for distribution planning, customer program targeting, and TOU enrollment design. In a related NewGen engagement for Peninsula Clean Energy, the system detected Level 2 EV charging with 92% accuracy and found 7,798 charging accounts not listed in DMV records.
Why treat meter data as an image?
GridLens™ reshapes each meter's history into a 2D array of days by hours. This enables it to apply convolutional neural networks, the same architectures behind medical imaging and satellite analytics, for load disaggregation. The model recognizes the visual fingerprint of EV charging, such as repeated late-evening stripes that are distinct from HVAC or water heating patterns.
Is it only for EV detection?
EV detection is the first delivery on AMI's original promise, but not the last. The same approach can reveal other types of loads hiding in the same data. AMI was introduced with the idea that all this data would make the grid smarter and easier to plan. GridLens™ is one example of that promise finally being realized.
See it on your own data.
The capacity you're searching for is already on your system—every 15 minutes.
Now there's a way to see it. Let's run GridLens™ on a sample of your AMI data and show you what it reveals.
Sources
- Burlig, F., Bushnell, J. B., & Rapson, D. S. (2026). If You Build It, They May Not Come: Willingness to Participate in Managed EV Charging. NBER Working Paper No. 35086.
- Smart Electric Power Alliance (SEPA). Set It and Save: Using Technology to Ensure a Smooth TOU Rate Transition.