

In the fall of 2024, the Environmental Protection Agency (EPA) finalized one of the most consequential utility regulations in a generation. The Lead and Copper Rule Improvements (LCRI) mandate that every water utility in America must replace 100% of its lead service lines by 2037. It's a health imperative that few dispute. It's also a financial earthquake that many utilities are still grappling with, and one that will reshape water rates and affordability across the country.
This is not a problem that will be solved with federal funding alone. The infrastructure bill allocated $15 billion for lead service line replacement. While $15 billion represents a substantial federal commitment, utilities estimate the total cost at $45-100 billion over 13 years. That unfunded gap falls squarely on utilities and their ratepayers. For many systems, especially those already struggling with affordability, it means choosing between compliance and keeping bills manageable.
Understanding LCRI in practical terms requires examining five key areas: mandate costs, funding sources, utility cost recovery mechanisms, customer burden impacts, and strategic decisions utilities should prioritize bringing a rate plan to the public.
And in several states the federal mandate is not the only deadline driving utility planning. Illinois's Lead Service Line Replacement and Notification Act (LSLRNA), New Jersey's accelerated 2031 statute, and Michigan's tiered timeline each layer state obligations on top of LCRI. Illinois's April 15, 2027 deadline for an IEPA-approvable final replacement plan is the most immediate driver for any utility operating in the state. For Illinois communities the federal and state regimes are not parallel; they are stacked, and the rate, financing, and private-side cost-share decisions a utility makes between now and April 2027 will define the next two decades of its capital and customer relationships.
The Mandate: LCRI and What It Requires
On October 30, 2024, the EPA published the final Lead and Copper Rule Improvements (89 FR 86418) after years of consultation with utilities, health advocates, and water systems. The rule is unambiguous: utilities must identify and replace the portion of all lead service lines that a utility owns (or co-owns) with non-lead material by November 1, 2037.
The action level for lead in drinking water drops from 15 parts per billion (ppb) to 10 ppb, which triggers more aggressive inventory and replacement timelines. If your system exceeds that level, replacement rates accelerate. For the majority of utilities, the mandate is achievable but expensive, and the cost curve is steep.
The 2037 deadline is not flexible. It is a federal compliance requirement, and non-compliance triggers enforcement action, penalties, and loss of Safe Drinking Water Act primacy. Utilities cannot budget their way out of this, they can only budget for it.
The Cost Landscape: From $6K to over $21K Per Connection
The price of lead service line replacement varies enormously. Dig up a line in Denver, CO, and you might pay $7,600. Do the same in Newark, NJ, and you might pay $6,500. In Washington D.C. that same line costs $21,000. The EPA's own average is $6,930. The American Water Works Association (AWWA) estimates closer to $8,247.
Why the range? Geographic factors matter: cost of labor, depth of services, street conditions, whether replacement happens alone or bundled with other main work, and whether you're replacing only the utility portion or financing the property owner's side too. A utility in rural Kentucky faces different economics than one in a dense urban core. And the upper end of the range increasingly reflects a policy choice as much as a physical one: the more of the customer-side line a municipality elects to fund, the higher the per-connection number climbs.
Per-Connection Replacement Cost Across Utilities
What does this mean for a mid-sized utility with 50,000 service lines and a 5% lead line inventory? That's 2,500 lines to replace. At the AWWA average of $8,247 per line, you're looking at roughly $20.6 million in direct replacement costs. If your utility's annual revenue is $80-100 million, this single mandate represents an unfunded capital obligation of 20-25% of annual revenue compressed into 13 years.
For utilities with higher lead concentrations (Flint, parts of Pittsburgh, Newark, Philadelphia), the multiples are even starker. For smaller systems with limited revenue bases but significant lead inventories, the math becomes genuinely difficult.
Federal Funding: $15 Billion Covers Only Part of the Picture
The Infrastructure Investment and Jobs Act (IIJA, signed in 2021) allocated $15 billion specifically for lead service line replacement through the Water Infrastructure Finance and Innovation Act (WIFIA) and state revolving funds (SRFs). This sounds like a substantial commitment, and in absolute terms it is. But against the total estimated cost, it's insufficient.
The IIJA funding covers 16-30% of the total need. For many utilities, especially in states with large lead inventories and multiple competing water infrastructure priorities, the share available to any single system is modest. The IIJA also includes a "forgiveness" component in that 49% of the WIFIA loans can be forgiven, effectively converting them to grants. This is important, but it doesn't eliminate the gap.
Lead Service Line Replacement: Funding Sources & the Gap
Federal allocation against estimated total need: the unfunded gap utilities must close through other means
Where does the rest come from? Utilities must close the gap through three mechanisms: (1) state and local bonds and grants, (2) rate increases, and (3) cost-sharing agreements with property owners. Most of the burden falls on mechanism two: rates.
How Utilities Are Recovering Costs: The Rate Design Question
There is no national playbook for cost recovery. Each utility is making its own decision about how to allocate the burden of lead service line replacement, and those decisions are consequential.
Generally, utilities are choosing between four approaches:
Base Rate Recovery
Spread costs across all customers through an increase in the base volumetric or fixed charge. Least visible to customers, but affects all users equally.
Equity-friendlyLead Service Line Surcharge
Apply a separate monthly charge to all customers (often $0.50-$2.00/month). Signals the cost; some are tied to metered usage.
Visible CostProperty Owner Cost-Share
Utilities pay for their portion; property owners pay for the customer-side. Reduces utility burden but requires owner participation, creates equity gaps, and is incompatible with state/federal full-line funding (e.g., IL SRF). In IL, postures range from full municipal funding (Wheaton) to a customer cap (Skokie $3,090) to 50% reimbursement (Northfield) to zero.
Feasibility & Political RiskHybrid/Tiered Approach
Combine mechanisms based on affordability and customer segment. E.g., full utility funding in low-income areas, cost-share in affluent ones.
Complex AdminCase Study: New Jersey American Water's Surcharge Model
New Jersey American Water, one of the largest lead service line replacement programs in the country, uses a dedicated monthly surcharge. Customers see a separate line item on their bill: currently around $0.91 per month on average. This approach has advantages: it's transparent (customers see what they're paying), it's progressive (tied to water usage for some segments), and it doesn't force a large rate hike on other services.
But transparency cuts both ways. Customers see the charge, question it, and in some cases resist it. It also requires regulatory approval, rate case proceedings, and public comment, all of which can slow deployment.
Case Study: Pennsylvania's DSIC Mechanism
Pennsylvania utilities, including American Water's Pennsylvania operations, can use the Danger, Safety, Inventory, and Capitalization (DSIC) mechanism. This allows utilities to surcharge for infrastructure investments without filing a full rate case, recovering costs faster. However, DSIC is subject to periodic review and possible rollback, so it's not a permanent solution. It's a financing tool, not a cost allocation philosophy.
Case Studies: Where the Private-Side Decision Becomes Key
Illinois communities have settled across the spectrum. Wheaton has elected to fund 100% of full-line replacement using utility capital. Skokie caps the customer's out-of-pocket exposure at $3,090 and finances that amount over 15 years through the water bill. Northfield reimburses 50% of eligible private-side cost up to $10,000. Each posture carries a different political risk profile, a different rate impact, and a different SRF eligibility outcome. The question facing every Illinois community before April 2027 is not whether to take a position, it is which position to take, and how to design the rate structure to back it up.
The private-side funding decision is not a technical cost-of-service question, it is a political question with cost-of-service consequences. Communities that defer the decision will discover the LSLRNA's April 15, 2027 final plan deadline forces it anyway. NewGen recommends running at least three private-side scenarios in parallel: zero municipal contribution; partial cost-share with affordability tiering; and full municipal funding with rate design optimized for distribution-plant classification. Each carries distinct rate impact, SRF eligibility, equity, and political-risk profiles, and the right answer is community-specific.
The cost recovery choice a utility makes now will shape its financial trajectory for 13 years. Base rate increases are less visible and more durable; surcharges are transparent but vulnerable to political challenge. No universally correct answer exists, but better answers emerge when utilities evaluate their particular system characteristics and stakeholder context.
Rate Impacts: What 4-15% Increases Look Like
Most utilities estimate lead service line replacement will add 4-15% to water and wastewater bills over the 13-year compliance window. For a residential customer paying $60/month for water and sewer combined, a 10% increase means an additional $6 per month, or $72 per year. Over 13 years, that's roughly $936 in additional charges tied to the mandate.
This doesn't sound catastrophic. And for customers with stable or growing incomes, it's manageable. But for households already struggling with water affordability, it's significant. And for utilities already facing other financial pressures such as aging pipe replacement, treatment cost increases due to PFAS, and decreases in customer demands, stacking an additional 4-15% on top of an already-planned 2-3% annual increase creates a rate shock.
Affordability: The Equity Crisis Hiding in Plain Sight
Lead service lines are not randomly distributed across utility service areas. They are concentrated in older neighborhoods, which overlap significantly with low-income and communities of color. In cities like Pittsburgh, Newark, Flint, Detroit, Cleveland, and Philadelphia, 40-70% of service lines are lead. In these same cities, poverty rates range from 20-35%, and median household income is 20-40% below state averages.
The EPA's own analysis found that roughly 12.1 to 19.2 million households in the United States struggle to afford water service, which is defined as spending more than 4% of household income on water. For a family earning $25,000 per year, a water bill above $1,000 annually pushes them into water poverty. Add a 10-15% rate increase for lead line replacement, and you're moving families deeper into that zone.
This dynamic creates an equity tension: the communities that stand to benefit most from lead removal. Low-income and BIPOC households with the highest exposures and are also the most financially burdened by the rate increases required to fund replacement programs. A utility that spreads the cost equally across all customers is, in effect, having low-income households subsidize their own health protection.
Utilities that ignore affordability risks face pushback from city councils, advocates, and regulators. Those that embed affordability into cost design from the start avoid years of conflict downstream.
State-by-State Status: Where Are We Now?
The mandate is national, but the response is intensely local. Some states have robust lead inventory programs and deployment strategies; others are still in the planning phase. Here's a snapshot of six key states:
Notice the pattern: BIL funding covers 25-35% of need in these states, leaving 65-75% to be recovered locally. In Midwest and Mid-Atlantic states with older infrastructure, the challenge is acute. Sun Belt utilities have more flexibility, but even there, older portions of cities (Atlanta, Austin, New Orleans) carry significant lead inventories.
Decision Point: What Your Utility Should Do Now
The federal compliance deadline is 2037. That's 11 years away. But the financial and regulatory decisions you make in 2026 will determine whether your utility navigates this transition smoothly or faces years of conflict and compromise. For Illinois utilities, the binding deadline is much closer: April 15, 2027. By that date every community water supply must submit a final, IEPA-approvable comprehensive replacement plan covering inventory verification, replacement sequencing, financing strategy, customer notification protocol, and a full-line replacement scope including the customer side. Utilities that arrive at April 2027 without resolved cost recovery and private-side funding policy will arrive without an approvable plan, and without an approvable plan they will lose access to the SRF capital that makes the program affordable in the first place.
1. Finalize your lead inventory. Know exactly how many lines you have, where they are, and what property owner engagement will look like. This is foundational.
2. Model your cost recovery options. Run rate projections for base rate recovery, surcharge, hybrid, and cost-share models. Stress-test each against economic scenarios. Which survives a recession? Which survives political pressure? Which is most equitable?
3. Engage your regulators and elected officials early. Don't wait for a rate case. Brief your public utility commission, your city council, and your governor's water office. Explain the mandate, the costs, the timeline, and the choices. Build political cover before rates become a campaign issue.
4. Develop an affordability program. This is not optional. It is a strategic necessity. Design low-income assistance, arrearage forgiveness, and discount programs now. Build them into your rate design from the start, not as an afterthought.
5. Pursue alternative funding. State bonds, local grants, EPA special funding (if you're in a priority area), and private investment partnerships. The $15 billion in IIJA funds will be allocated; position your system to compete for it.
6. Plan for operational scaling. Replacing 50,000 service lines over 13 years means replacing 3,850 lines per year, every year. That requires contractor capacity, project management bandwidth, and supply chain resilience. Start building those muscles now.
7. Resolve the private-side funding question. If you operate in Illinois, this is the most consequential single decision in your April 2027 plan. The choice between zero municipal contribution, a capped customer cost-share, partial reimbursement, and full municipal funding determines your rate impact, your SRF eligibility, your equity profile, and your political risk. Run all four scenarios, present them to elected officials, and pick a posture you can defend at the next election.
Utilities that move decisively on cost design, private-side funding policy, and affordability integration will be the success stories of the next decade. Those that delay, hoping for more federal money or clearer guidance, will face compressed timelines, political backlash, and worse outcomes. For Illinois, the time horizon for "decisive action" is measured in months, not years.
The Broader Lesson: Infrastructure Equity in Action
Lead service line replacement is not just a technical or financial challenge. It is a test of whether utilities and regulators can align health equity with rate design and whether they can acknowledge that the mandate is unfunded, that the burden falls on ratepayers, and that the burden is not distributed equally.
Some utilities will pass this test. Others will not. The ones that do will be the ones that front-load the equity conversation, design affordability into rates, engage customers transparently, and make the case to regulators that this is a shared responsibility.
The EPA has set the mandate. Congress allocated partial funding. The rest is up to utilities, regulators, and communities. How you navigate it will define your utility's relationship with its customers for years to come.
This blog post is a narrative companion to NewGen's full Lead Service Line Replacement research report, which provides detailed analysis of cost models, funding mechanisms, state regulations, and case studies from utilities implementing large-scale replacement programs.
Read the full Research ReportModel Your Utility's Replacement Strategy
The numbers in this article are national. Your numbers aren't. Every utility's program cost, rate impact, and SRF eligibility profile is shaped by inventory composition, ownership cost split, funding-mix assumptions, the regulatory window you operate under, and the private-side posture you ultimately defend. NewGen's water rates and infrastructure team builds scenario models that turn the LCRI and state mandates into a board-ready conversation about real choices, not abstract policy.
Below are two views from the scenario modeling we run for utility clients — a federal LCRI baseline for a mid-sized system, and the same plan stress-tested against alternative timelines and the state and federal mandate floors:
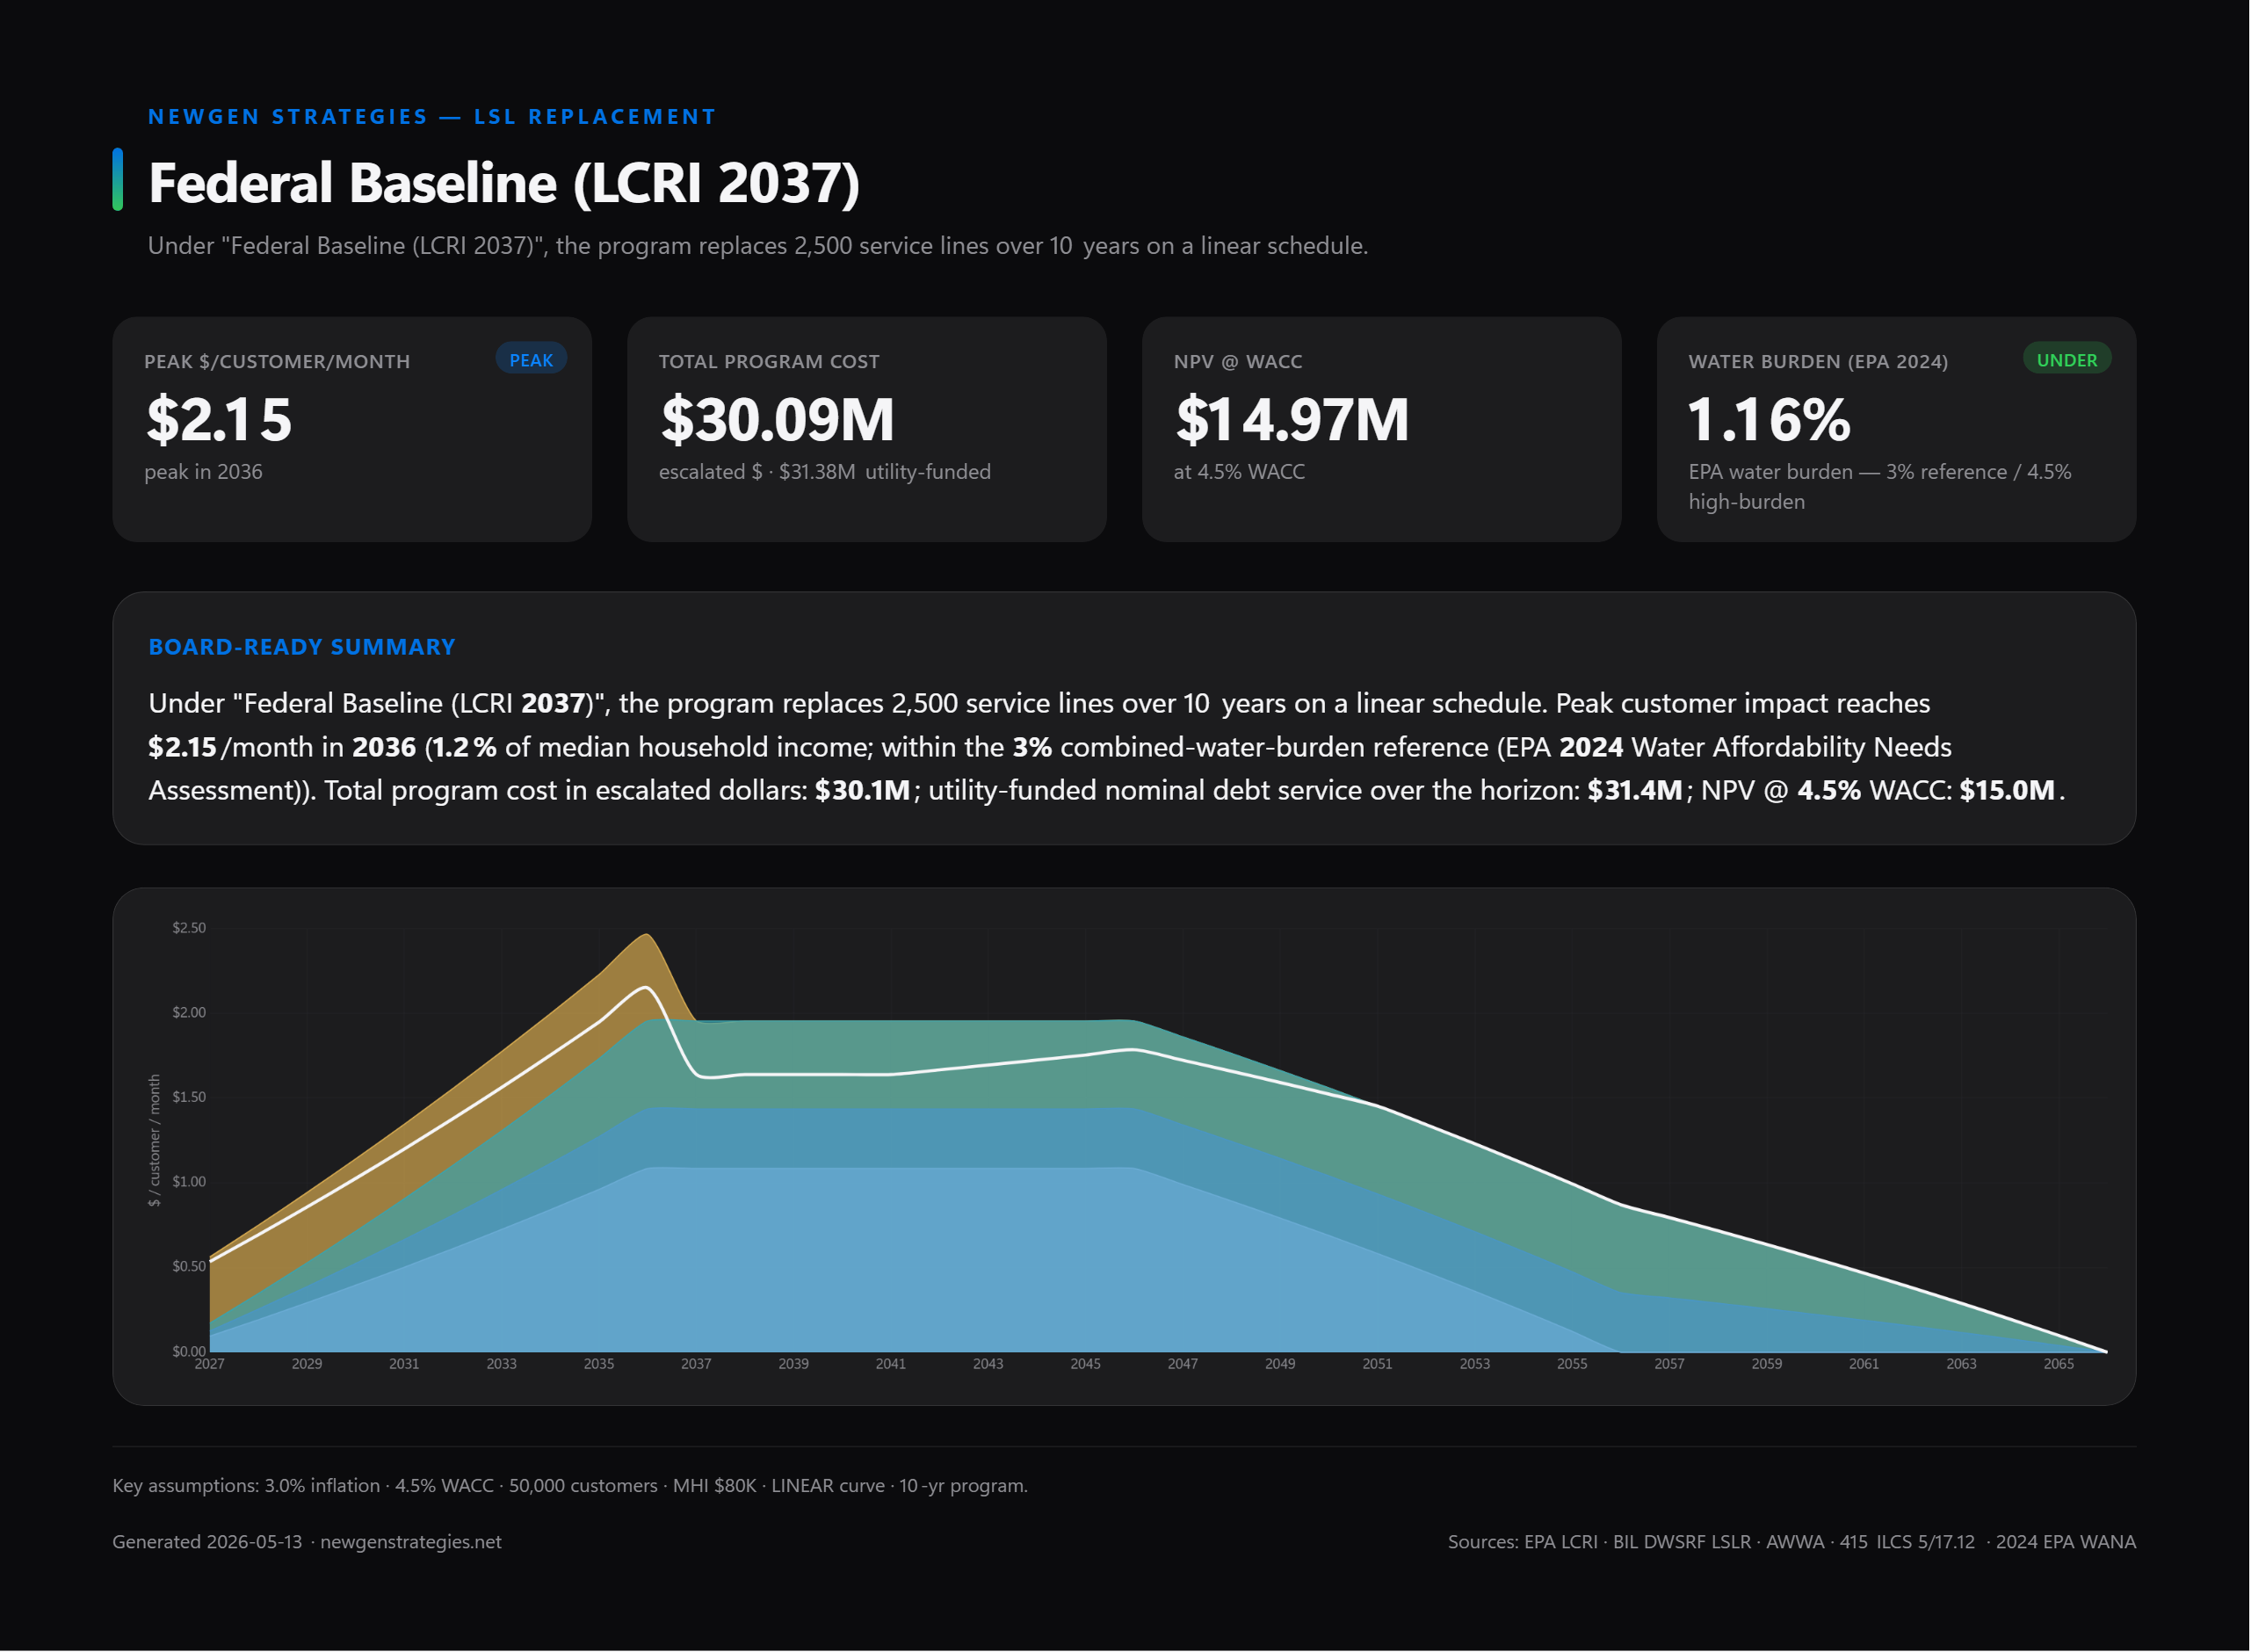
What we model for clients:
- Replacement-pace scenarios across federal LCRI, IL LSLRNA tiers, NJ 2031, MI 2041, and stretched compliance timelines
- Funding-mix optimization — state SRF, BIL DWSRF LSLR set-aside (with 49% forgiveness floor), GO bonds, PAYGO, and grants — with rate, term, and forgiveness levers
- Private-side cost-share postures — zero municipal contribution, capped customer cost-share, partial reimbursement, full municipal funding — and the rate, SRF eligibility, and political-risk consequences of each
- Affordability stress tests against EPA's 2024 Water Affordability Needs Assessment thresholds (3% combined / 4.5% high-burden)
- Customer-side recovery design — rebate, out-of-pocket, and bill-financed cohorts with on-bill loan surcharge math for participating customers
Talk to our water-rates team
If you are an Illinois community working toward the April 15, 2027 LSLRNA filing — or any utility planning your LCRI cost recovery, rate path, and private-side funding policy — we can stand up a scenario model for your system in days, not months. Let's walk through your inventory and the choices in front of you.